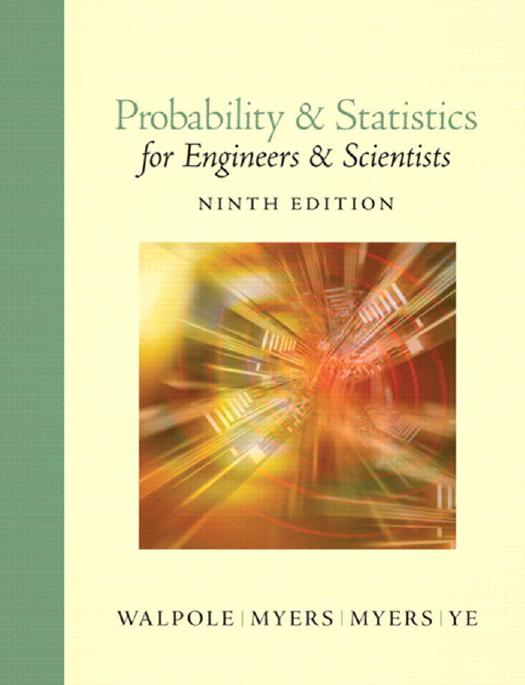
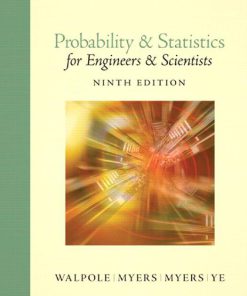
Probability and Statistics for Engineers and Scientists 9th edition by Ronald Walpole, Raymond Myers, Sharon Myers, Keying Ye 0134115856 9780134115856
$50.00 Original price was: $50.00.$25.00Current price is: $25.00.
Authors:Ronald E. Walpole; Raymond H. Myers; Sharon L. Myers; Keying Ye , Series:Mechanical engineering [81] , Tags:Technology & Engineering; Mechanical; Mechtronics , Author sort:Walpole, Ronald E. & Myers, Raymond H. & Myers, Sharon L. & Ye, Keying , Ids:9780134115856 , Languages:Languages:eng , Published:Published:Nov 2017 , Publisher:Pearson , Comments:Comments:For junior/senior undergraduates taking probability and statistics as applied to engineering, science, or computer science. This classic text provides a rigorous introduction to basic probability theory and statistical inference, with a unique balance between theory and methodology. Interesting, relevant applications use real data from actual studies, showing how the concepts and methods can be used to solve problems in the field. This revision focuses on improved clarity and deeper understanding. This latest edition is also available in as an enhanced Pearson eText. This exciting new version features an embedded version of StatCrunch, allowing students to analyze data sets while reading the book. Also available with MyStatLab MyStatLab(tm) is an online homework, tutorial, and assessment program designed to work with this text to engage students and improve results. Within its structured environment, students practice what they learn, test their understanding, and pursue a personalized study plan that helps them absorb course material and understand difficult concepts. Note: You are purchasing a standalone product; MyLab(tm) & Mastering(tm) does not come packaged with this content. Students, if interested in purchasing this title with MyLab & Mastering, ask your instructor for the correct package ISBN and Course ID. Instructors, contact your Pearson representative for more information. If you would like to purchase both the physical text and MyLab & Mastering, search for: 0134468910 / 9780134468914 Probability & Statistics for Engineers & Scientists, MyStatLab Update with MyStatLab plus Pearson eText — Access Card Package 9/e Package consists of: 0134115856 / 9780134115856 Probability & Statistics for Engineers & Scientists, MyStatLab Update 0321847997 / 9780321847997 My StatLab Glue-in Access Card 032184839X / 9780321848390 MyStatLab Inside Sticker for Glue-In Packages
Probability and Statistics for Engineers and Scientists 9th edition by Ronald Walpole, Raymond Myers, Sharon Myers, Keying Ye – Ebook PDF Instant Download/Delivery. 0134115856, 9780134115856
Full download Probability and Statistics for Engineers and Scientists 9th Edition after payment
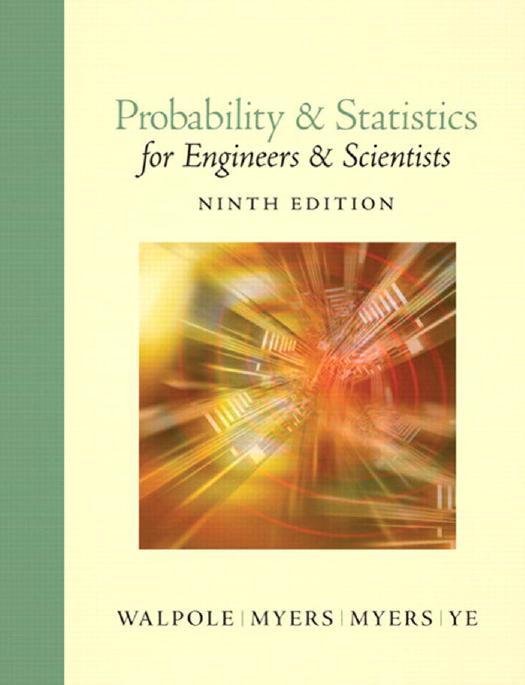
Product details:
ISBN 10: 0134115856
ISBN 13: 9780134115856
Author: Ronald E. Walpole; Raymond H. Myers; Sharon L. Myers; Keying E. Ye
For junior/senior undergraduates taking probability and statistics as applied to engineering, science, or computer science. This classic text provides a rigorous introduction to basic probability theory and statistical inference, with a unique balance between theory and methodology. Interesting, relevant applications use real data from actual studies, showing how the concepts and methods can be used to solve problems in the field. This revision focuses on improved clarity and deeper understanding. This latest edition is also available in as an enhanced Pearson eText. This exciting new version features an embedded version of StatCrunch, allowing students to analyze data sets while reading the book. Also available with MyStatLab MyStatLab™ is an online homework, tutorial, and assessment program designed to work with this text to engage students and improve results. Within its structured environment, students practice what they learn, test their understanding, and pursue a personalized study plan that helps them absorb course material and understand difficult concepts. Note: You are purchasing a standalone product; MyLab™ & Mastering™ does not come packaged with this content. Students, if interested in purchasing this title with MyLab & Mastering, ask your instructor for the correct package ISBN and Course ID. Instructors, contact your Pearson representative for more information. If you would like to purchase both the physical text and MyLab & Mastering, search for: 0134468910 / 9780134468914 Probability & Statistics for Engineers & Scientists, MyStatLab Update with MyStatLab plus Pearson eText — Access Card Package 9/e Package consists of: 0134115856 / 9780134115856 Probability & Statistics for Engineers & Scientists, MyStatLab Update 0321847997 / 9780321847997 My StatLab Glue-in Access Card 032184839X / 9780321848390 MyStatLab Inside Sticker for Glue-In Packages
Probability and Statistics for Engineers and Scientists 9th Table of contents:
Chapter 1 Introduction to Statistics and Data Analysis
1.1 Overview: Statistical Inference, Samples, Populations, and the Role of Probability
Use of Scientific Data
Variability in Scientific Data
The Role of Probability
How do Probability and Statistical Inference Work Together?
1.2 Sampling Procedures; Collection of Data
Simple Random Sampling
Experimental Design
Why Assign Experimental Units Randomly?
1.3 Measures of Location: The Sample Mean and Median
Other Measures of Locations
Exercises
1.4 Measures of Variability
Sample Range and Sample Standard Deviation
Units for Standard Deviation and Variance
Which Variability Measure is More Important?
Exercises
1.5 Discrete and Continuous Data
What Kinds of Problems are Solved in Binary Data Situations?
1.6 Statistical Modeling, Scientific Inspection, and Graphical Diagnostics
Scatter Plot
Stem-and-Leaf Plot
Histogram
Box-and-Whisker Plot or Box Plot
Other Distinguishing Features of a Sample
1.7 General Types of Statistical Studies: Designed Experiment, Observational Study, and Retrospective Study
What is Interaction?
What if Factors are Not Controlled?
Exercises
Chapter 2 Probability
2.1 Sample Space
2.2 Events
Exercises
2.3 Counting Sample Points
Exercises
2.4 Probability of an Event
2.5 Additive Rules
Exercises
2.6 Conditional Probability, Independence, and the Product Rule
Conditional Probability
Independent Events
The Product Rule, or the Multiplicative Rule
Exercises
2.7 Bayes’ Rule
Total Probability
Bayes’ Rule
Exercises
Review Exercises
2.8 Potential Misconceptions and Hazards; Relationship to Material in Other Chapters
Chapter 3 Random Variables and Probability Distributions
3.1 Concept of a Random Variable
3.2 Discrete Probability Distributions
3.3 Continuous Probability Distributions
Exercises
3.4 Joint Probability Distributions
Statistical Independence
What Are Important Characteristics of Probability Distributions and Where Do They Come From?
Exercises
Review Exercises
3.5 Potential Misconceptions and Hazards; Relationship to Material in Other Chapters
Chapter 4 Mathematical Expectation
4.1 Mean of a Random Variable
Exercises
4.2 Variance and Covariance of Random Variables
Exercises
4.3 Means and Variances of Linear Combinations of Random Variables
What If the Function Is Nonlinear?
4.4 Chebyshev’s Theorem
Exercises
Review Exercises
4.5 Potential Misconceptions and Hazards; Relationship to Material in Other Chapters
Chapter 5 Some Discrete Probability Distributions
5.1 Introduction and Motivation
5.2 Binomial and Multinomial Distributions
The Bernoulli Process
Binomial Distribution
Where Does the Name Binomial Come From?
Areas of Application
Multinomial Experiments and the Multinomial Distribution
Exercises
5.3 Hypergeometric Distribution
Hypergeometric Distribution in Acceptance Sampling
Relationship to the Binomial Distribution
Exercises
5.4 Negative Binomial and Geometric Distributions
What Is the Negative Binomial Random Variable?
Applications of Negative Binomial and Geometric Distributions
5.5 Poisson Distribution and the Poisson Process
Properties of the Poisson Process
Nature of the Poisson Probability Function
Approximation of Binomial Distribution by a Poisson Distribution
Exercises
Review Exercises
5.6 Potential Misconceptions and Hazards; Relationship to Material in Other Chapters
Chapter 6 Some Continuous Probability Distributions
6.1 Continuous Uniform Distribution
6.2 Normal Distribution
6.3 Areas under the Normal Curve
Using the Normal Curve in Reverse
6.4 Applications of the Normal Distribution
Exercises
6.5 Normal Approximation to the Binomial
Exercises
6.6 Gamma and Exponential Distributions
Relationship to the Poisson Process
Applications of the Exponential and Gamma Distributions
The Memoryless Property and Its Effect on the Exponential Distribution
6.7 Chi-Squared Distribution
6.8 Beta Distribution
6.9 Lognormal Distribution
6.10 Weibull Distribution (Optional)
The Failure Rate for the Weibull Distribution
Interpretation of the Failure Rate
Exercises
Review Exercises
6.11 Potential Misconceptions and Hazards; Relationship to Material in Other Chapters
Chapter 7 Functions of Random Variables (Optional)
7.1 Introduction
7.2 Transformations of Variables
7.3 Moments and Moment-Generating Functions
Linear Combinations of Random Variables
Exercises
Chapter 8 Fundamental Sampling Distributions and Data Descriptions
8.1 Random Sampling
Populations and Samples
8.2 Some Important Statistics
Location Measures of a Sample: The Sample Mean, Median, and Mode
Variability Measures of a Sample: The Sample Variance, Standard Deviation, and Range
Exercises
8.3 Sampling Distributions
Inference about the Population from Sample Information
What Is the Sampling Distribution of Xˉ?
8.4 Sampling Distribution of Means and the Central Limit Theorem
The Central Limit Theorem
Inferences on the Population Mean
Sampling Distribution of the Difference between Two Means
What Do We Learn from Case Study 8.2?
More on Sampling Distribution of Means—Normal Approximation to the Binomial Distribution
Exercises
8.5 Sampling Distribution of S2
Degrees of Freedom as a Measure of Sample Information
8.6 t-Distribution
What Does the t-Distribution Look Like?
What Is the t-Distribution Used For?
8.7 F-Distribution
The F-Distribution with Two Sample Variances
What Is the F-Distribution Used For?
8.8 Quantile and Probability Plots
Quantile Plot
Normal Quantile-Quantile Plot
Normal Probability Plotting
Exercises
Review Exercises
8.9 Potential Misconceptions and Hazards; Relationship to Material in Other Chapters
Chapter 9 One- and Two-Sample Estimation Problems
9.1 Introduction
9.2 Statistical Inference
9.3 Classical Methods of Estimation
Unbiased Estimator
Variance of a Point Estimator
Interval Estimation
Interpretation of Interval Estimates
9.4 Single Sample: Estimating the Mean
One-Sided Confidence Bounds
The Case of σ Unknown
Concept of a Large-Sample Confidence Interval
9.5 Standard Error of a Point Estimate
9.6 Prediction Intervals
Use of Prediction Limits for Outlier Detection
9.7 Tolerance Limits
Distinction among Confidence Intervals, Prediction Intervals, and Tolerance Intervals
Exercises
9.8 Two Samples: Estimating the Difference between Two Means
The Experimental Conditions and the Experimental Unit
Variances Unknown but Equal
Interpretation of the Confidence Interval
Equal Sample Sizes
Unknown and Unequal Variances
9.9 Paired Observations
When Should Pairing Be Done?
Tradeoff between Reducing Variance and Losing Degrees of Freedom
Exercises
9.10 Single Sample: Estimating a Proportion
Choice of Sample Size
9.11 Two Samples: Estimating the Difference between Two Proportions
Exercises
9.12 Single Sample: Estimating the Variance
9.13 Two Samples: Estimating the Ratio of Two Variances
Exercises
9.14 Maximum Likelihood Estimation (Optional)
The Likelihood Function
Additional Comments Concerning Maximum Likelihood Estimation
Exercises
Review Exercises
9.15 Potential Misconceptions and Hazards; Relationship to Material in Other Chapters
Chapter 10 One- and Two-Sample Tests of Hypotheses
10.1 Statistical Hypotheses: General Concepts
The Role of Probability in Hypothesis Testing
The Null and Alternative Hypotheses
10.2 Testing a Statistical Hypothesis
The Test Statistic
The Probability of a Type I Error
The Probability of a Type II Error
The Role of α, β, and Sample Size
Illustration with a Continuous Random Variable
One- and Two-Tailed Tests
How Are the Null and Alternative Hypotheses Chosen?
10.3 The Use of P-Values for Decision Making in Testing Hypotheses
Preselection of a Significance Level
A Graphical Demonstration of a P-Value
How Does the Use of P-Values Differ from Classic Hypothesis Testing?
Exercises
10.4 Single Sample: Tests Concerning a Single Mean
Tests on a Single Mean (Variance Known)
Standardization of Xˉ
Relationship to Confidence Interval Estimation
Tests on a Single Sample (Variance Unknown)
Comment on the Single-Sample t-Test
Annotated Computer Printout for Single-Sample t-Test
10.5 Two Samples: Tests on Two Means
Unknown But Equal Variances
Unknown But Unequal Variances
Paired Observations
Problem of Interaction in a Paired t-Test
What Conditions Result in Interaction?
Annotated Computer Printout for Paired t-Test
Summary of Test Procedures
10.6 Choice of Sample Size for Testing Means
Two-Sample Case
10.7 Graphical Methods for Comparing Means
Annotated Computer Printout for Two-Sample t-Test
Exercises
10.8 One Sample: Test on a Single Proportion
10.9 Two Samples: Tests on Two Proportions
Exercises
10.10 One- and Two-Sample Tests Concerning Variances
Robustness of χ2-Test to Assumption of Normality
F-Test for Testing Variances in SAS
Exercises
10.11 Goodness-of-Fit Test
10.12 Test for Independence (Categorical Data)
10.13 Test for Homogeneity
Testing for Several Proportions
10.14 Two-Sample Case Study
Statistical Significance and Engineering or Scientific Significance
Exercises
Review Exercises
10.15 Potential Misconceptions and Hazards; Relationship to Material in Other Chapters
Chapter 11 Simple Linear Regression and Correlation
11.1 Introduction to Linear Regression
11.2 The Simple Linear Regression (SLR) Model
The Fitted Regression Line
Another Look at the Model Assumptions
11.3 Least Squares and the Fitted Model
The Method of Least Squares
What Is Good about Least Squares?
Exercises
11.4 Properties of the Least Squares Estimators
Mean and Variance of Estimators
Partition of Total Variability and Estimation of σ2
The Estimator of σ2 as a Mean Squared Error
11.5 Inferences Concerning the Regression Coefficients
Hypothesis Testing on the Slope
Statistical Inference on the Intercept
A Measure of Quality of Fit: Coefficient of Determination
Pitfalls in the Use of R2
11.6 Prediction
Prediction Interval
Exercises
11.7 Choice of a Regression Model
11.8 Analysis-of-Variance Approach
Annotated Computer Printout for Simple Linear Regression
11.9 Test for Linearity of Regression: Data with Repeated Observations
Concept of Lack of Fit
What Is the Importance in Detecting Lack of Fit?
Annotated Computer Printout for Test for Lack of Fit
Exercises
11.10 Data Plots and Transformations
What Are the Implications of a Transformed Model?
Diagnostic Plots of Residuals: Graphical Detectionof Violation of Assumptions
Nonhomogeneous Variance
Normal Probability Plotting
11.11 Simple Linear Regression Case Study
11.12 Correlation
Exercises
Review Exercises
11.13 Potential Misconceptions and Hazards; Relationship to Material in Other Chapters
Chapter 12 Multiple Linear Regression and Certain Nonlinear Regression Models
12.1 Introduction
12.2 Estimating the Coefficients
Polynomial Regression
12.3 Linear Regression Model Using Matrices
Exercises
12.4 Properties of the Least Squares Estimators
Analysis of Variance in Multiple Regression
12.5 Inferences in Multiple Linear Regression
Individual t-Tests for Variable Screening
Inferences on Mean Response and Prediction
Annotated Printout for Data of Example 12.4
More on Analysis of Variance in Multiple Regression (Optional)
Degrees of Freedom
Hypothesis of Interest
Exercises
12.6 Choice of a Fitted Model through Hypothesis Testing
The Adjusted Coefficient of Determination (Radj2)
How Are R2 and Radj2 Affected by Removal of x3?
Test on an Individual Coefficient
Does a Single Variable t-Test Have an F Counterpart?
Partial F-Tests on Subsets of Coefficients
12.7 Special Case of Orthogonality (Optional)
Exercises
12.8 Categorical or Indicator Variables
Model with Categorical Variables
Three Categories
Slope May Vary with Indicator Categories
Exercises
12.9 Sequential Methods for Model Selection
Illustration of Variable Screening in the Presence of Collinearity
Stepwise Regression
Summary
Choice of P-Values
12.10 Study of Residuals and Violation of Assumptions (Model Checking)
Illustration of Outlier Detection
Plotting Residuals for Case Study 12.1
Normality Checking
12.11 Cross Validation, Cp, and Other Criteria for Model Selection
Use of the PRESS Statistic
The Cp Statistic
Exercises
12.12 Special Nonlinear Models for Nonideal Conditions
Nonhomogeneous Variance
Binary Response (Logistic Regression)
What Is the Model for Logistic Regression?
Characteristics of Logistic Function
Estimate of Effective Dose
Concept of Odds Ratio
Exercises
Review Exercises
12.13 Potential Misconceptions and Hazards; Relationship to Material in Other Chapters
Chapter 13 One-Factor Experiments: General
13.1 Analysis-of-Variance Technique
Two Sources of Variability in the Data
13.2 The Strategy of Experimental Design
13.3 One-Way Analysis of Variance: Completely Randomized Design (One-Way ANOVA)
Assumptions and Hypotheses in One-Way ANOVA
Model for One-Way ANOVA
Resolution of Total Variability into Components
Use of F-Test in ANOVA
F-Ratio for Testing Equality of Means
13.4 Tests for the Equality of Several Variances
Exercises
13.5 Single-Degree-of-Freedom Comparisons
13.6 Multiple Comparisons
Relationship between T and F
Confidence Interval Approach to a Paired Comparison
Experiment-wise Error Rate
Tukey’s Test
Where Does the α-Level Come From in Tukey’s Test?
Duncan’s Test
Dunnett’s Test: Comparing Treatment with a Control
Exercises
13.7 Comparing a Set of Treatments in Blocks
What Is the Purpose of Blocking?
13.8 Randomized Complete Block Designs
Model for the RCB Design
Further Comments Concerning Blocking
Interaction between Blocks and Treatments
13.9 Graphical Methods and Model Checking
What Is a Residual for an RCB Design?
13.10 Data Transformations in Analysis of Variance
Where Does Nonhomogeneous Variance Come From?
Exercises
13.11 Random Effects Models
Model and Assumptions for Random Effects Model
Estimation of Variance Components
Randomized Block Design with Random Blocks
13.12 Case Study
Residual Plots
Exercises
Review Exercises
13.13 Potential Misconceptions and Hazards; Relationship to Material in Other Chapters
Chapter 14 Factorial Experiments (Two or More Factors)
14.1 Introduction
Main Effects and Interaction
14.2 Interaction in the Two-Factor Experiment
Interaction and the Interpretation of Main Effects
A Graphical Look at Interaction
Need for Multiple Observations
14.3 Two-Factor Analysis of Variance
Model and Hypotheses for the Two-Factor Problem
Partitioning of Variability in the Two-Factor Case
Formation of Mean Squares
Impact of Significant Interaction in Example 14.1
Graphical Analysis for the Two-Factor Problem of Example 14.1
Exercises
14.4 Three-Factor Experiments
Impact of Interaction BC
Pooling in Multifactor Models
Factorial Experiments in Blocks
Exercises
14.5 Factorial Experiments for Random Effectsand Mixed Models
Mixed Model Experiment
Exercises
Review Exercises
14.6 Potential Misconceptions and Hazards; Relationship to Material in Other Chapters
Chapter 15 2k Factorial Experiments and Fractions
15.1 Introduction
Factor Screening and Sequential Experimentation
Screening Designs for Large Numbers of Factors
15.2 The 2k Factorial: Calculation of Effects and Analysis of Variance
Computation of Sums of Squares
The 23 Factorial
Effects and Sums of Squares for the 2k
15.3 Nonreplicated 2k Factorial Experiment
Diagnostic Plotting with Nonreplicated 2k Factorial Experiments
Interpretation of Two-Factor Interaction
Analysis with Pooled Mean Square Error: Annotated Computer Printout
Exercises
15.4 Factorial Experiments in a Regression Setting
Interaction in the Regression Model
15.5 The Orthogonal Design
Standard Error of Coefficients and T-Tests
A More Thorough Look at the Orthogonality Property in the 2k Factorial
Center Runs with 2k Designs
Center Runs and Lack of Fit
An Intuitive Look at the Test on Curvature
Exercises
15.6 Fractional Factorial Experiments
Construction of 12 Fraction
Aliases in the 23−1
How Aliases Are Determined in General
Formal Construction of the 2k−1
Construction of the 14 Fraction
15.7 Analysis of Fractional Factorial Experiments
Exercises
15.8 Higher Fractions and Screening Designs
Design Resolution
15.9 Construction of Resolution III and IV Designs with 8, 16, and 32 Design Points
15.10 Other Two-Level Resolution III Designs; The Plackett-Burman Designs
15.11 Introduction to Response Surface Methodology
The Second-Order Response Surface Model
Other Comments Concerning Response Surface Analysis
15.12 Robust Parameter Design
Control and Noise Variables
The Product Array
Noise Factors: Tolerances on Control Factors
Simultaneous Analysis of Process Mean and Variance
Alternative Approaches to Robust Parameter Design
The Role of the Control-by-Noise Interaction
Analysis Involving the Model Containing Both Control and Noise Variables
The Mean and Variance Response Surfaces
Exercises
Review Exercises
15.13 Potential Misconceptions and Hazards; Relationship to Material in Other Chapters
Chapter 16 Nonparametric Nonparametric Statistics
16.1 Nonparametric Tests
Sign Test
16.2 Signed-Rank Test
Two Samples with Paired Observations
Normal Approximation for Large Samples
Exercises
16.3 Wilcoxon Rank-Sum Test
Normal Theory Approximation for Two Samples
16.4 Kruskal-Wallis Test
Exercises
16.5 Runs Test
16.6 Tolerance Limits
16.7 Rank Correlation Coefficient
Exercises
Review Exercises
Chapter 17 Statistical Quality Control
17.1 Introduction
The Control Chart
17.2 Nature of the Control Limits
17.3 Purposes of the Control Chart
17.4 Control Charts for Variables
Rational Subgroups
Xˉ-Chart with Estimated Parameters
R-Charts to Control Variation
Xˉ- and R-Charts for Variables
Further Comments about Control Charts for Variables
Choice of Sample Size (Operating Characteristic Function) in the Case of the Xˉ-Chart
Choice of Sample Size for the R-Chart
Xˉ- and S-Charts for Variables
17.5 Control Charts for Attributes
The p-Chart for Fraction Defective
Choice of Sample Size for the p-Chart
Control Charts for Defects (Use of the Poisson Model)
17.6 Cusum Control Charts
Decision Rule for Cusum Charts
Review Exercises
Chapter 18 Bayes Bayesian Statistics
18.1 Bayesian Concepts
Subjective Probability
Conditional Perspective
Bayesian Applications
18.2 Bayesian Inferences
Point Estimation Using the Posterior Distribution
Bayesian Interval Estimation
18.3 Bayes Estimates Using Decision Theory Framework
Squared-Error Loss
Absolute-Error Loss
Exercises
Bibliography
Appendix A Statistical Tables and Proofs
A.24 Proof of Mean of the Hypergeometric Distribution
A.25 Proof of Mean and Variance of the Poisson Distribution
A.26 Proof of Mean and Variance of the Gamma Distribution
Appendix B Answers to Odd-Numbered Non-Review Exercises
People also search for Probability and Statistics for Engineers and Scientists 9th:
probability and statistics for engineers and the sciences
probability and statistics for engineers and the scientists 9th edition
probability and statistics for engineering and the sciences 9e pdf
probability and statistics for engineers and scientists updated 9th edition

