

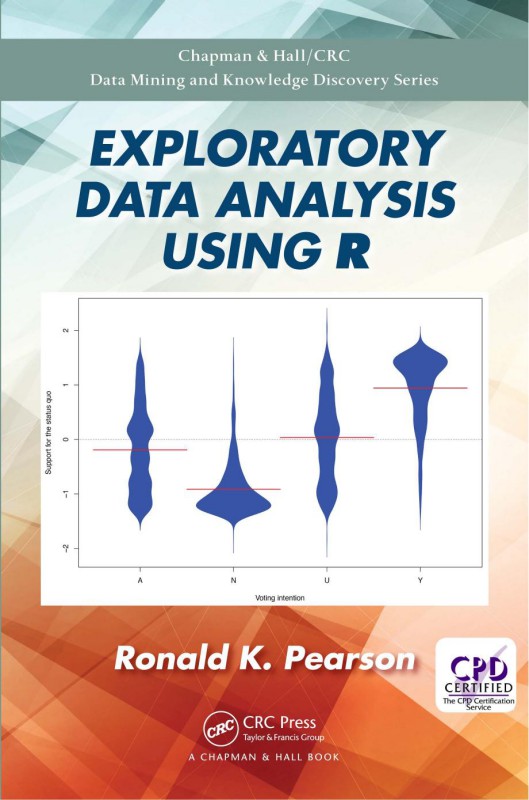
Exploratory Data Analysis Using R 1st edition by Ronald Pearson 9780429847042 0429847041


Original price was: $50.00.$25.00Current price is: $25.00.
Authors:Ronald K. Pearson , Series:Computer Science [135] , Tags:Statistics Economics; Data Mining; Computer Games Programming , Author sort:Pearson, Ronald K. , Ids:9780367571566 , Languages:Languages:eng , Published:Published:Jun 2020 , Publisher:CRC Press , Comments:Comments:Exploratory Data Analysis Using R provides a classroom-tested introduction to exploratory data analysis (EDA) and introduces the range of interesting – good, bad, and ugly – features that can be found in data, and why it is important to find them. It also introduces the mechanics of using R to explore and explain data.The book begins with a detailed overview of data, exploratory analysis, and R, as well as graphics in R. It then explores working with external data, linear regression models, and crafting data stories. The second part of the book focuses on developing R programs, including good programming practices and examples, working with text data, and general predictive models. The book ends with a chapter on keeping it all together that includes managing the R installation, managing files, documenting, and an introduction to reproducible computing.The book is designed for both advanced undergraduate, entry-level graduate students, and working professionals with little to no prior exposure to data analysis, modeling, statistics, or programming. it keeps the treatment relatively non-mathematical, even though data analysis is an inherently mathematical subject. Exercises are included at the end of most chapters, and an instructor’s solution manual is available.About the Author: Ronald K. Pearson holds the position of Senior Data Scientist with GeoVera, a property insurance company in Fairfield, California, and he has previously held similar positions in a variety of application areas, including software development, drug safety data analysis, and the analysis of industrial process data. He holds a PhD in Electrical Engineering and Computer Science from the Massachusetts Institute of Technology and has published conference and journal papers on topics ranging from nonlinear dynamic model structure selection to the problems of disguised missing data in predictive modeling. Dr. Pearson has authored or co-authored books including Exploring Data in Engineering, the Sciences, and Medicine (Oxford University Press, 2011) and Nonlinear Digital Filtering with Python. He is also the developer of the DataCamp course on base R graphics and is an author of the datarobot and GoodmanKruskal R packages available from CRAN (the Comprehensive R Archive Network).
Exploratory Data Analysis Using R 1st edition by Ronald Pearson- Ebook PDF Instant Download/Delivery.9780429847042, 0429847041
Full download Exploratory Data Analysis Using R 1st edition after payment
Product details:
ISBN 10: 0429847041
ISBN 13: 9780429847042
Author: Ronald K. Pearson
Exploratory Data Analysis Using R 1st Table of contents:
-
Data, Exploratory Analysis, and R
1.1 Why do we analyze data?
1.2 The view from 90,000 feet
1.2.1 Data
1.2.2 Exploratory analysis
1.2.3 Computers, software, and R
1.3 A representative R session
1.4 Organization of this book
1.5 Exercises -
Graphics in R
2.1 Exploratory vs. explanatory graphics
2.2 Graphics systems in R
2.2.1 Base graphics
2.2.2 Grid graphics
2.2.3 Lattice graphics
2.2.4 The ggplot2 package
2.3 The plot function
2.3.1 The flexibility of the plot function
2.3.2 S3 classes and generic functions
2.3.3 Optional parameters for base graphics
2.4 Adding details to plots
2.4.1 Adding points and lines to a scatterplot
2.4.2 Adding text to a plot
2.4.3 Adding a legend to a plot
2.4.4 Customizing axes
2.5 A few different plot types
2.5.1 Pie charts and why they should be avoided
2.5.2 Barplot summaries
2.5.3 The symbols function
2.6 Multiple plot arrays
2.6.1 Setting up simple arrays with mfrow
2.6.2 Using the layout function
2.7 Color graphics
2.7.1 A few general guidelines
2.7.2 Color options in R
2.7.3 The tableplot function
2.8 Exercises -
Exploratory Data Analysis: A First Look
3.1 Exploring a new dataset
3.1.1 A general strategy
3.1.2 Examining the basic data characteristics
3.1.3 Variable types in practice
3.2 Summarizing numerical data
3.2.1 “Typical” values: the mean
3.2.2 “Spread”: the standard deviation
3.2.3 Limitations of simple summary statistics
3.2.4 The Gaussian assumption
3.2.5 Is the Gaussian assumption reasonable?
3.3 Anomalies in numerical data
3.3.1 Outliers and their influence
3.3.2 Detecting univariate outliers
3.3.3 Inliers and their detection
3.3.4 Metadata errors
3.3.5 Missing data, possibly disguised
3.3.6 QQ-plots revisited
3.4 Visualizing relations between variables
3.4.1 Scatterplots between numerical variables
3.4.2 Boxplots: numerical vs. categorical variables
3.4.3 Mosaic plots: categorical scatterplots
3.5 Exercises -
Working with External Data
4.1 File management in R
4.2 Manual data entry
4.2.1 Entering the data by hand
4.2.2 Manual data entry is bad but sometimes expedient
4.3 Interacting with the Internet
4.3.1 Previews of three Internet data examples
4.3.2 A very brief introduction to HTML
4.4 Working with CSV files
4.4.1 Reading and writing CSV files
4.4.2 Spreadsheets and csv files are not the same thing
4.4.3 Two potential problems with CSV files
4.5 Working with other file types
4.5.1 Working with text files
4.5.2 Saving and retrieving R objects
4.5.3 Graphics files
4.6 Merging data from different sources
4.7 A brief introduction to databases
4.7.1 Relational databases, queries, and SQL
4.7.2 An introduction to the sqldf package
4.7.3 An overview of R’s database support
4.7.4 An introduction to the RSQLite package
4.8 Exercises -
Linear Regression Models
5.1 Modeling the whiteside data
5.1.1 Describing lines in the plane
5.1.2 Fitting lines to points in the plane
5.1.3 Fitting the whiteside data
5.2 Overfitting and data splitting
5.2.1 An overfitting example
5.2.2 The training/validation/holdout split
5.2.3 Two useful model validation tools
5.3 Regression with multiple predictors
5.3.1 The Cars93 example
5.3.2 The problem of collinearity
5.4 Using categorical predictors
5.5 Interactions in linear regression models
5.6 Variable transformations in linear regression
5.7 Robust regression: a very brief introduction
5.8 Exercises -
Crafting Data Stories
6.1 Crafting good data stories
6.1.1 The importance of clarity
6.1.2 The basic elements of an effective data story
6.2 Different audiences have different needs
6.2.1 The executive summary or abstract
6.2.2 Extended summaries
6.2.3 Longer documents
6.3 Three example data stories
6.3.1 The Big Mac and Grande Latte economic indices
6.3.2 Small losses in the Australian vehicle insurance data
6.3.3 Unexpected heterogeneity: the Boston housing data -
Programming in R
7.1 Interactive use versus programming
7.1.1 A simple example: computing Fibonacci numbers
7.1.2 Creating your own functions
7.2 Key elements of the R language
7.2.1 Functions and their arguments
7.2.2 The list data type
7.2.3 Control structures
7.2.4 Replacing loops with apply functions
7.2.5 Generic functions revisited
7.3 Good programming practices
7.3.1 Modularity and the DRY principle
7.3.2 Comments
7.3.3 Style guidelines
7.3.4 Testing and debugging
7.4 Five programming examples
7.4.1 The function ValidationRsquared
7.4.2 The function TVHsplit
7.4.3 The function PredictedVsObservedPlot
7.4.4 The function BasicSummary
7.4.5 The function FindOutliers
7.5 R scripts
7.6 Exercises -
Working with Text Data
8.1 The fundamentals of text data analysis
8.1.1 The basic steps in analyzing text data
8.1.2 An illustrative example
8.2 Basic character functions in R
8.2.1 The nchar function
8.2.2 The grep function
8.2.3 Application to missing data and alternative spellings
8.2.4 The sub and gsub functions
8.2.5 The strsplit function
8.2.6 Another application: ConvertAutoMpgRecords
8.2.7 The paste function
8.3 A brief introduction to regular expressions
8.3.1 Regular expression basics
8.3.2 Some useful regular expression examples
8.4 An aside: ASCII vs. UNICODE
8.5 Quantitative text analysis
8.5.1 Document-term and document-feature matrices
8.5.2 String distances and approximate matching
8.6 Three detailed examples
8.6.1 Characterizing a book
8.6.2 The cpus data frame
8.6.3 The unclaimed bank account data
8.7 Exercises -
Exploratory Data Analysis: A Second Look
9.1 An example: repeated measurements
9.1.1 Summary and practical implications
9.1.2 The gory details
9.2 Confidence intervals and significance
9.2.1 Probability models versus data
9.2.2 Quantiles of a distribution
9.2.3 Confidence intervals
9.2.4 Statistical significance and p-values
9.3 Characterizing a binary variable
9.3.1 The binomial distribution
9.3.2 Binomial confidence intervals
9.3.3 Odds ratios
9.4 Characterizing count data
9.4.1 The Poisson distribution and rare events
9.4.2 Alternative count distributions
9.4.3 Discrete distribution plots
9.5 Continuous distributions
9.5.1 Limitations of the Gaussian distribution
9.5.2 Some alternatives to the Gaussian distribution
9.5.3 The qqPlot function revisited
9.5.4 The problems of ties and implosion
9.6 Associations between numerical variables
9.6.1 Product-moment correlations
9.6.2 Spearman’s rank correlation measure
People also search for Exploratory Data Analysis Using R 1st :
exploratory multivariate data analysis by example using r
uses exploratory data analysis
exploratory data analysis example
exploratory data analysis in r example
You may also like…


eBook PDF
Nursing Research Using Data Analysis 1st Edition by Mary De Chesnay 9780826126894 0826126898